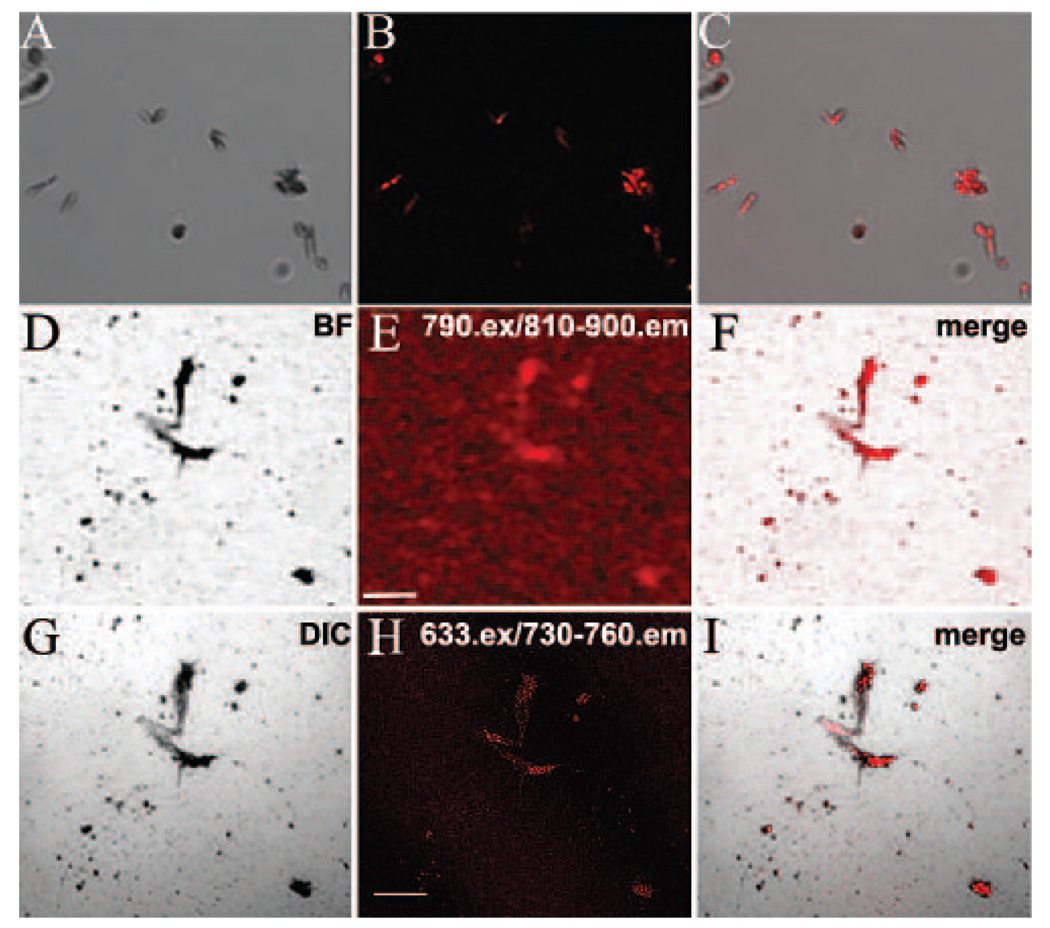
FIGURE 4.
AF imaging of purified melanosomes isolated from mouse RPE sheets. (A–C) DIC and confocal micrographs of peak AF(ex.633) emission, illustrating colocalization between melanosomes and peak AF(ex.633). (D–I) Low-magnification AF imaging, using either CSLO (D–F) or SDCM (G–I), to image the same region of a microscope slide containing isolated melanosomes. Slides were shipped between laboratories; in this case, the “inverted T” signature of melanosomes clustered with cellular debris (evident in the center) was used to help identify the given region. Comparable AF patterns are apparent with either AF(ex.790) or AF(ex.633) (E, H). Scale bar, 100 µm.

