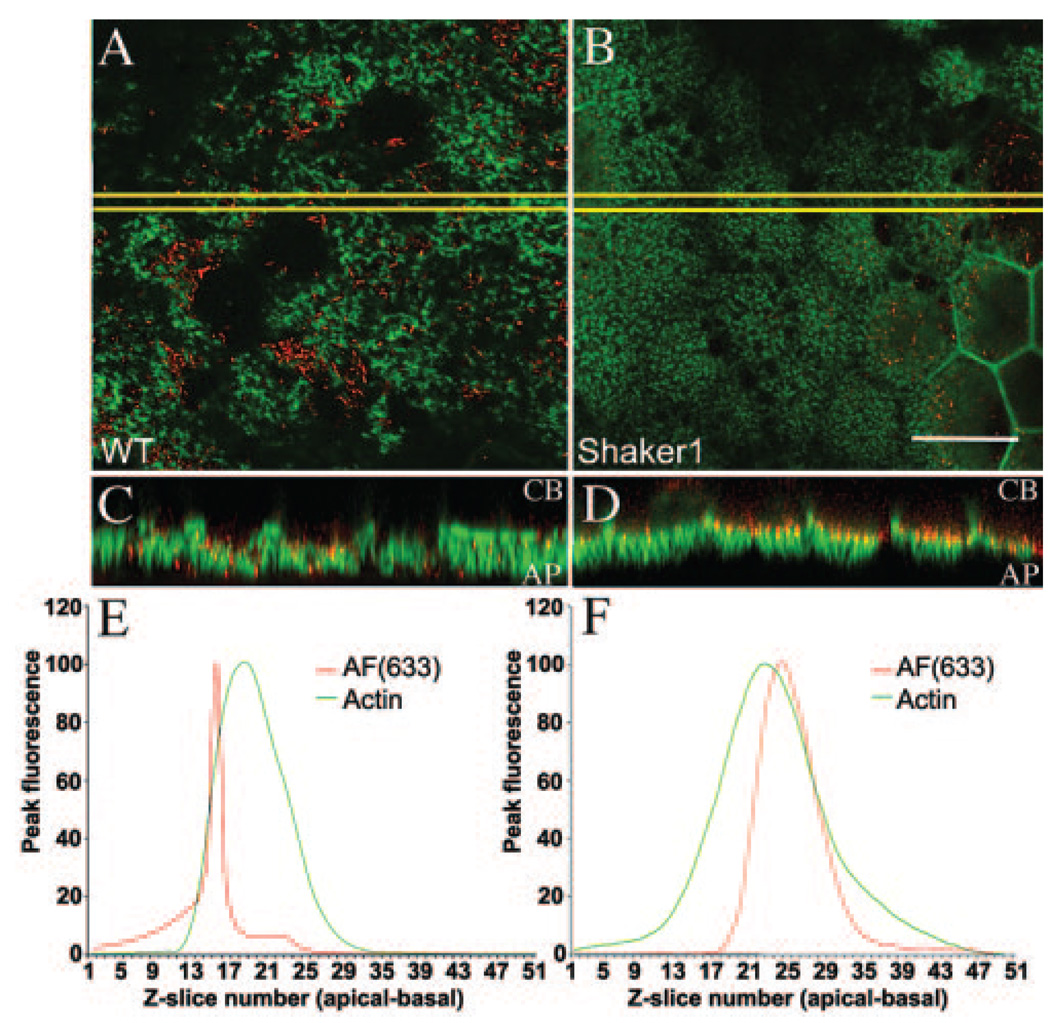
FIGURE 5.
AF(ex.633) imaging of melanosomes in Myo7a-null RPE. Confocal microscopy of whole-mount eyecups, showing single optical sections through the apical processes of control (A) and mutant (B) RPE. AF(ex.633) emitting at 730 to 760 nm is shown in red and FITC-phalloidin labeling of F-actin in green. The mutant image is slightly oblique. AF was evident only on the right part of the image, where it passed into the cell body. Boxed regions (yellow) were used for 3-D reconstruction to generate 90°-rotated projections of control (C) and mutant (D) apical RPE. AF(ex.633) signals in the control were evident throughout the apical F-actin region. By contrast, they are distributed only along the basal aspect of this region in the mutant. Quantification of AF(ex.633) (red) and FITC-phalloidin (green) fluorescence intensities along the z-axis of control (E) and mutant (F) apical RPE showed no significant change in actin localization, but a significant basal shift of AF(ex.633) in mutant compared with the control. Scale bar, 25 µm.

