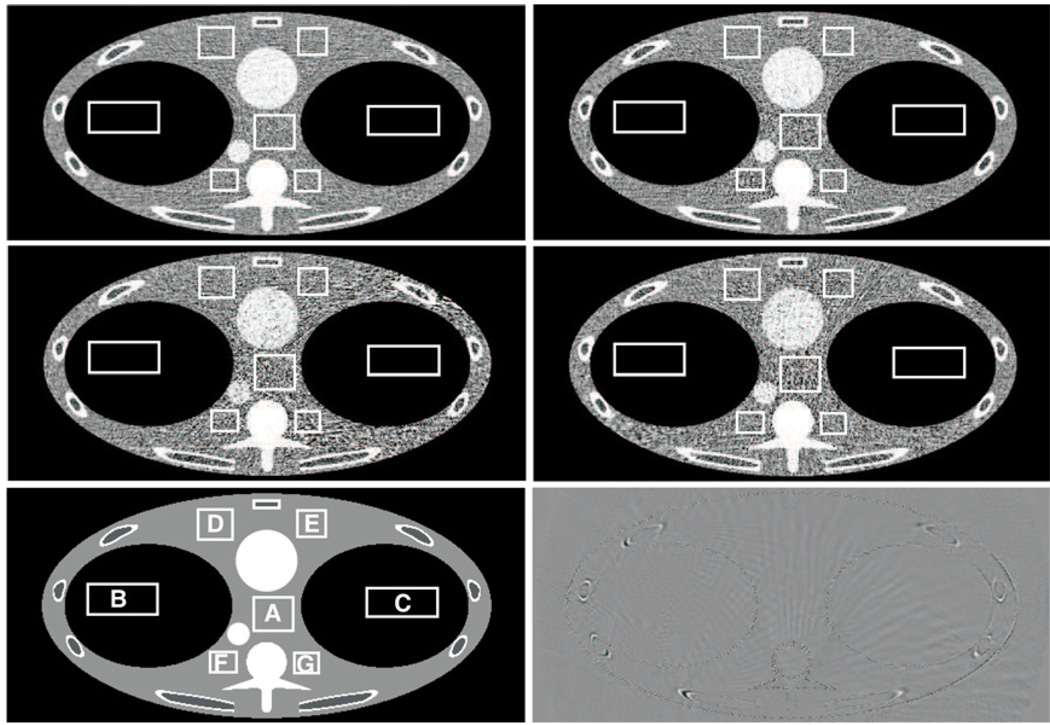
Figure 8.
Reconstruction of the FORBILD thorax phantom with Poisson noise added to the data, assuming an emission of 150 000 photons per ray. The standard deviation measurements reported in table 2 were evaluated in the rectangular areas. Top left: combined reconstruction . Top right: reconstruction V*(0), which is based only on the M-line surfaces defined with wsurf = 0. Middle left: reconstruction V*(wmax), which is based only on the surfaces defined with wsurf = wmax. Middle right: reconstruction V*(wmin), which is based only on the surfaces defined with wsurf = wmin. Bottom left: ground truth. Bottom right: difference image between and V*(0). The following grayscale window was used in all cases: [−50, 50] HU.

