
Figure 2.
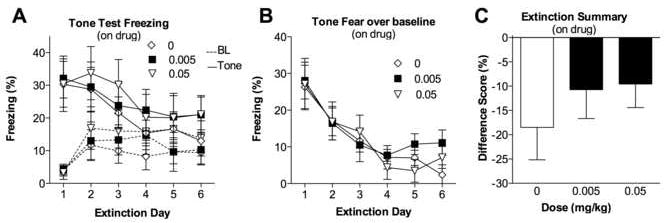
(A) Percentage of time spent freezing during baseline (BL) and the average of the first 5 tone presentations (Tone) for each of the six on-drug extinction trial days. Each group represents the dose (mg/kg) of amphetamine given prior to each extinction trial. (B) Percentage of time spent freezing during the first tone block (first 5 tone presentations averaged) over baseline for each extinction day. (C) Difference between the percentages time spent freezing over baseline during the first tone block (first 5 tone presentations) on extinction Day 6 and extinction Day 1. All groups show evidence of extinction. Amphetamine did not affect between-trial or overall extinction. Each point represents the M ± SEM.