
Figure 2.
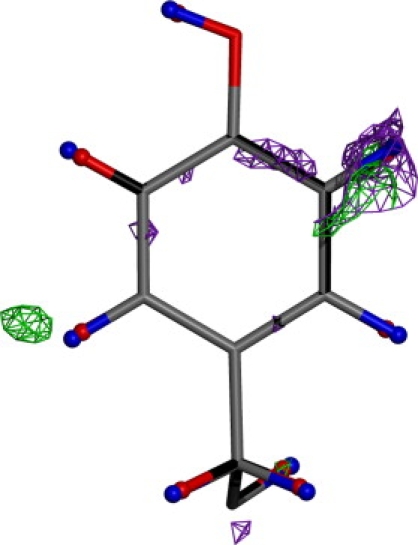
Tyr-53 from the lysozyme model with electron density (σA-weighted Fo-Fc maps, contoured at 1.8 σ) obtained before (purple) and after (green) introduction of the aspherical and anisotropic scattering model. Also highlighted are the hydrogen positions before (red) and after (blue) the same procedure. Note the average lengthening of X-H bonds and the disappearance of difference density at bond centers.