
Figure 3.
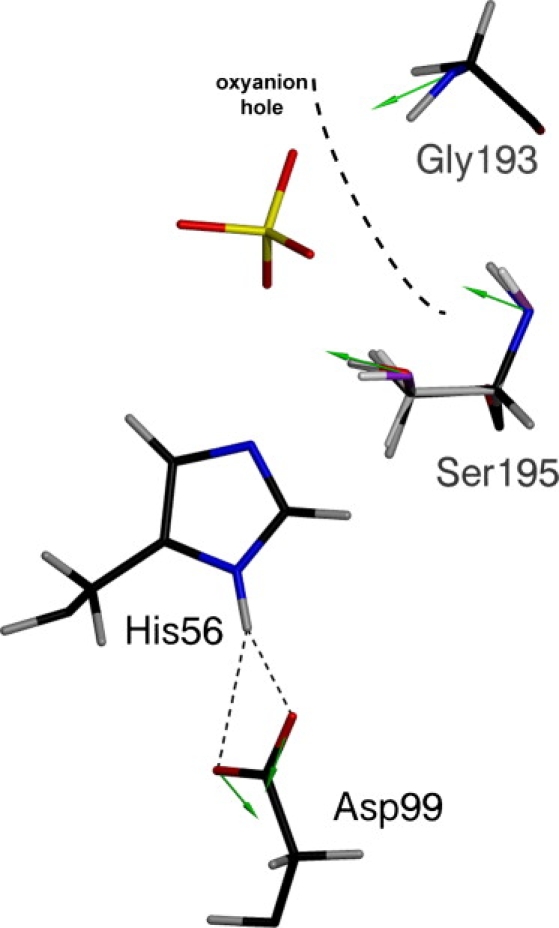
Trypsin catalytic triad prior (purple hydroxyl group on Ser-195) and after (red hydroxyl group on Ser-195) introduction of the electrostatic model. The oxyanion hole is depicted with the thick black dashed line. Residue numbering corresponds to trypsin from Fusarium oxysporum. Green arrows represent polarization vectors at the displayed atomic positions. A 3.0 Å vector length corresponds to 1 D.