
Figure 5.
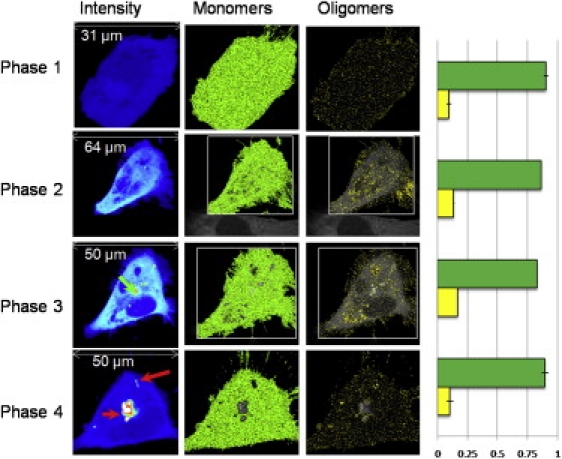
Time evolution of ST14A cell transiently transfected with Httex1p-97QP-EGFP, cells were imaged with 0.8% laser power at 488 nm and 20 μs/pixel. (First column) Intensity image, the green arrow indicates a nucleation point; red arrows indicate the inclusions. (Second column) Selection of pixels with the brightness of the monomers (B = 1.074, ɛ = 3700 cpsm). (Third column) Selection of oligomers (centered on decamer, B = 1.74, ɛ = 37,000 cpsm). In the fourth column the percentage of pixels with brightness corresponding to monomer (green) and oligomer (yellow) in different cells in the four phases are reported. The percentage of oligomers increases until the inclusion is formed and recruits the majority of the protein.