
Figure 4.
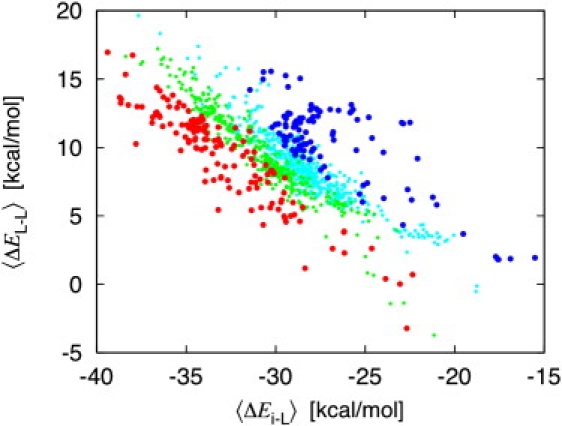
Correlation between the mean ion-ligand interaction (bottom) and the total ion-ligand and ligand-ligand mean energy (top) calculated for the 1077 reduced models for different range of the Na+/K+ relative free energies: highly selective for K+ over Na+ (ΔΔGNa,K > +3 kcal/mol, blue circles), weakly selective for K+ over Na+ (0 kcal/mol < ΔΔGNa,K < 3 kcal/mol, magenta circles), weakly selective for Na+ over K+ (−3 kcal/mol < ΔΔGNa,K < 0 kcal/mol, green circles), and highly selective for Na+ over K+ (ΔΔGNa,K < −3 kcal/mol, red circles).