
Figure 6.
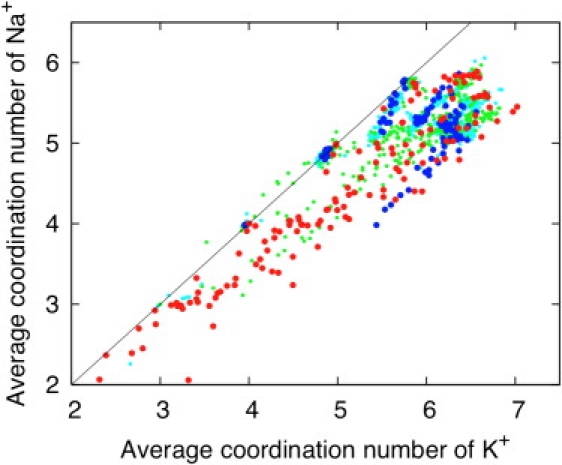
Correlation between the selectivity displayed by a reduced model and the mean canonical coordination number n of Na+ or K+ (calculated by counting the average number oxygen ligands within 3.0 Å away from K+ and within 2.8 Å away from Na+). The results for the 1077 reduced models are shown. The color code corresponding to different range of the Na+/K+ relative free energies is the same as in Fig. 4: highly selective for K+ over Na+ (ΔΔGNa,K > +3 kcal/mol, blue circles), weakly selective for K+ over Na+ (0 kcal/mol < ΔΔGNa,K < 3 kcal/mol, magenta circles), weakly selective for Na+ over K+ (−3 kcal/mol < ΔΔGNa,K < 0 kcal/mol, green circles), and highly selective for Na+ over K+ (ΔΔGNa,K < −3 kcal/mol, red circles).