
Figure 3.
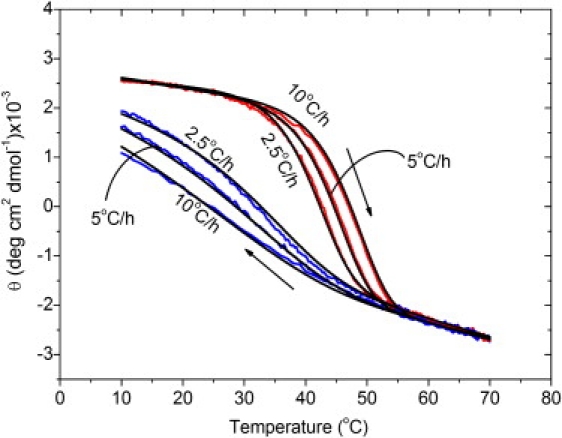
Fitting of the hysteresis of peptide (Gly-Pro-Pro)10 at different scanning rates. Data for the three rates were fitted simultaneously (see text). Mean molar ellipticities θ were recorded as a function of temperature at c0 = 0.25 mM and scanning rates of 2, 5, and 10°C/h. The experimental heating and cooling curves are plotted in red (light gray) and blue (dark gray), respectively. The curves fitted by model 2 are indicated as black lines.