
Figure 6.
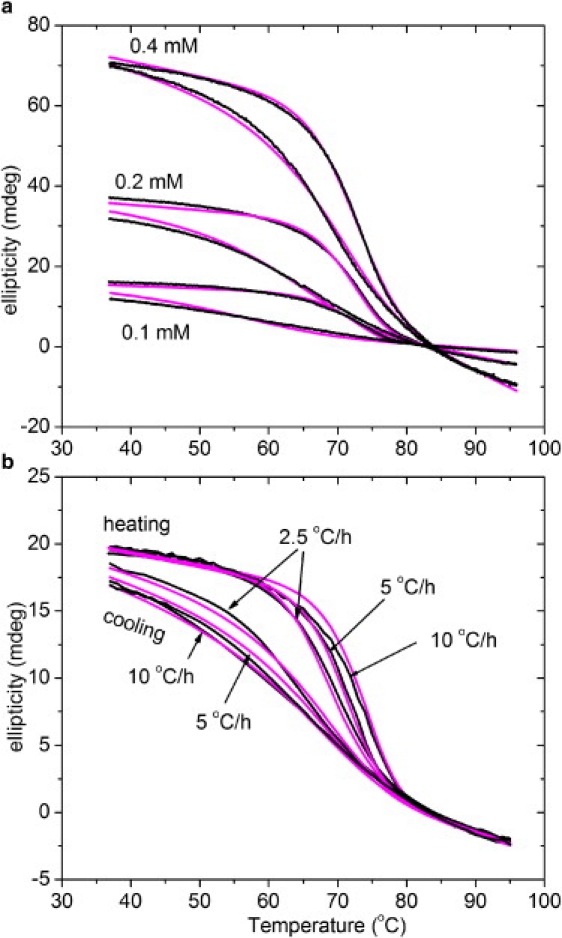
Fitting of hysteresis loops of (Gly-Pro-4(R)Hyp)10 with model 3. (a) Effect of concentration with constant scanning rate of 10°C/h. (b) Effect of scanning rate with constant peptide concentration of 0.1 mM. The experimental data and fitted results are indicated by black and magenta (light gray) lines, respectively.