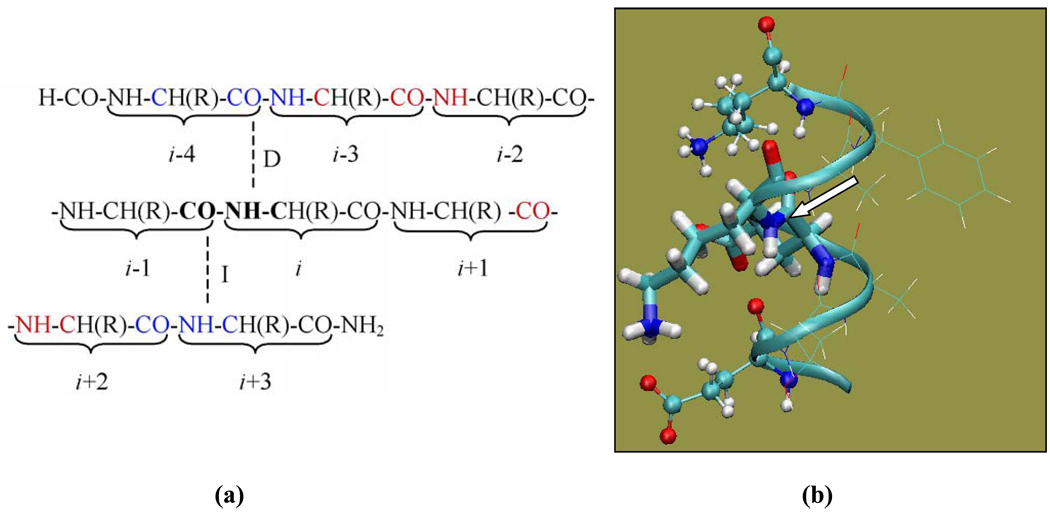
Fig. 1.
(a) Illustration of the basis set assignment. The dashed lines represent the direct (D) and indirect (I) hydrogen bonds for the peptide plane containing the amide group of residue i. (b) Illustration of various peptide fragment models used in the calculations. In the case of amide nitrogen of K28 shown here, Model A (a dipeptide model) includes E27 and K28 (thick sticks); Model B includes residues from Model A (thick sticks) and the two hydrogen bonding partners (ball-and-stick); Model C includes all residues from E24 to K31 (ribbon). Residues shown in thin-line representation are included in Model C but not in Model B. The molecular image was generated using VMD (Humphrey et al., 1996). The arrow points to the amide nitrogen whose chemical shielding is being calculated

