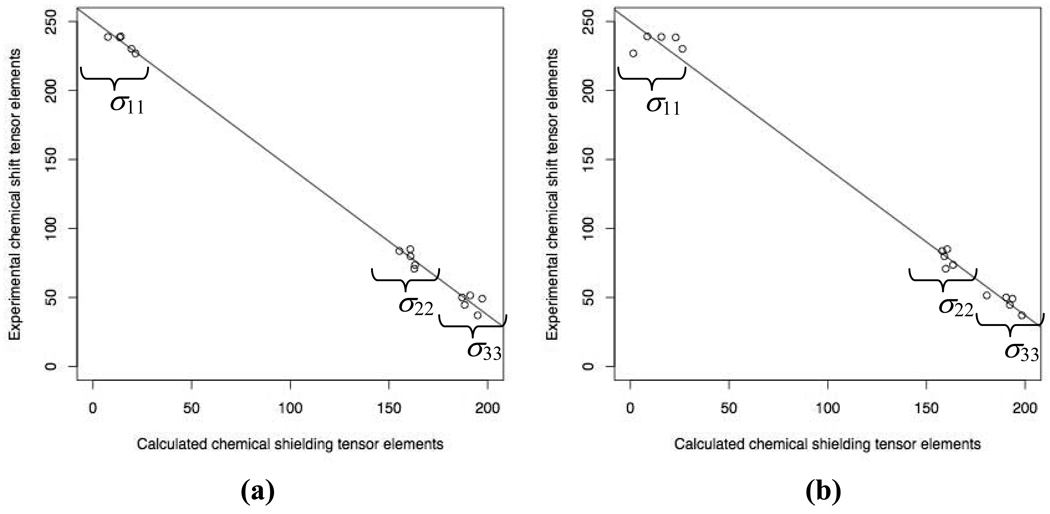
Fig. 5.
Comparison of the principal values of the calculated 15N chemical shielding tensor for GB3 with the corresponding values of the experimental chemical shift tensor for GB1 (from solid-state NMR measurements (Wylie et al. 2007)). The model used and the parameters of the regression line are as follows: (a) Model C, intercept = 250.88 ± 2.24 ppm, slope = −1.07 ± 0.02; (b) “Model C neutral”, intercept = 249.98 ± 4.11 ppm, slope = −1.07 ± 0.03

