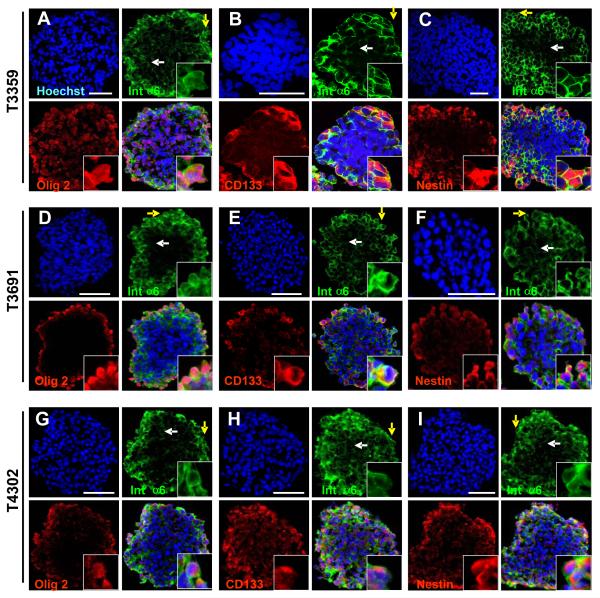
Figure 3. Integrin α6 co-segregates with CD133-positive GSCs.
Immunostaining analysis of cryosections from tumorspheres generated from GSC enriched populations (T3359, T3691, T4302) show the peripheral region (yellow arrow, enlarged inset in bottom right corner) which appears to correlate with high integrin α6 expression and the inner region (white arrow), which is low in integrin α6 expression. Photomicrographs show integrin α6 (green) is co-expressed with GSC markers Olig2 (red, A, D, E), CD133 (red, B, E, H), and nestin (red, C, F, I). All nuclei counterstained with Hoechst in blue. Scale bar, 10 μm.

