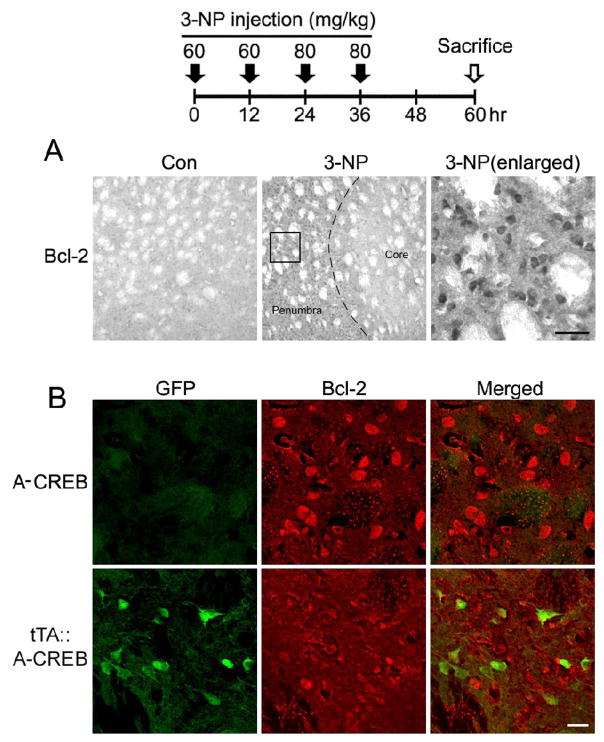
Figure 5. Neuroprotective gene expression within the penumbral region.
Top: time course depicting the 3-NP injection and sacrifice schedule for experiments presented in A and B. A. Relative to vehicle-injected mice, 3-NP intoxication led to a marked increase in Bcl-2 expression within the penumbral region. Dashed line approximates the core/penumbral boarder. Boxed region is shown to the right. Scale bar: 50 μm. B. Representative double immunofluorescence labeling within the penumbra for Bcl-2 and for the A-CREB transgene marker GFP. Of note, relative to Bcl-2 expression in the monotransgenic A-CREB mouse, modest Bcl-2 expression was observed in the tTA::A-CREB mouse. Further, merging the GFP and Bcl-2 images reveals a lack of overlapping signals, suggesting that A-CREB represses Bcl-2 expression. Scale bar = 20 μm.

