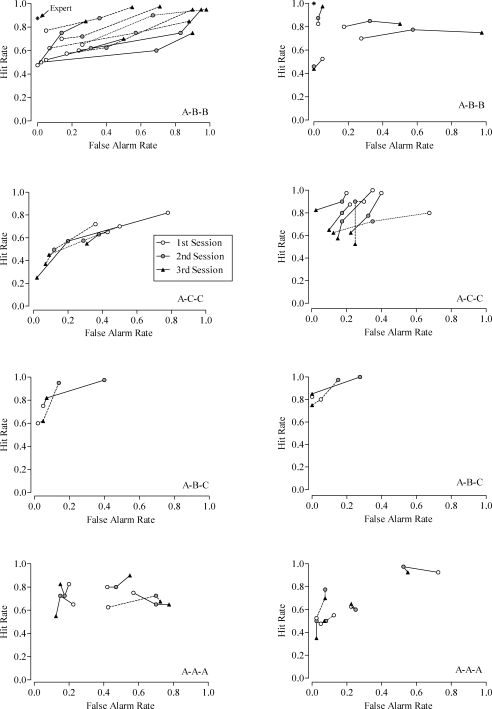
Figure 2.
Hit rates and false alarm rates for the participants in Experiment 1 (left) and Experiment 2 (right) across the three scoring sessions. Data are grouped according to the sequence of conditions experienced. Different line patterns are used for some data sets to assist with visual inspection. The asterisks show the expert's hit and false alarm rates in Experiment 1 and Experiment 2.

