
Figure 3.

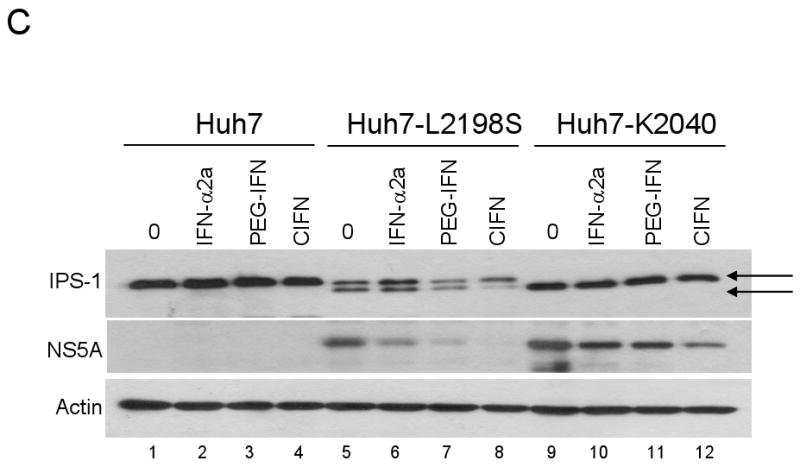
Comparison of the antiviral effects rendered by the IFNs on HCV RNA replicon containing cells. (A) Immunoblot analysis of Huh7 cells (lanes 1-4 on both panels) and Huh7 cells harboring the HCV RNA replicons after incubation with the Cmax of each IFN for the indicated times. HCV NS5A protein levels were quantified by densitometry analysis and the values are displayed below the corresponding lane as a percentage of the protein within matched control cells cultured with media alone. Control values from nontreated cells were set at 100%. (B) ELISA of NPT II protein levels from HCV-K2040 (green) and HCV-HP (red) IFN treated cells. The calculated EC50 of each IFN is displayed under the corresponding graph. Data are representative of three independent experiments. (C) Immunoblot analysis of endogenous IPS-1, NS5A and actin expression in control Huh7 cells (lanes1-4), Huh7-L2198S cells (lanes 5-8) and Huh7-K2040 cells (lanes 9-12) cultured with media alone (0) or Cmax of each IFN for 72 hours. Arrows denote the full length (FL) and cleaved forms of IPS-1.