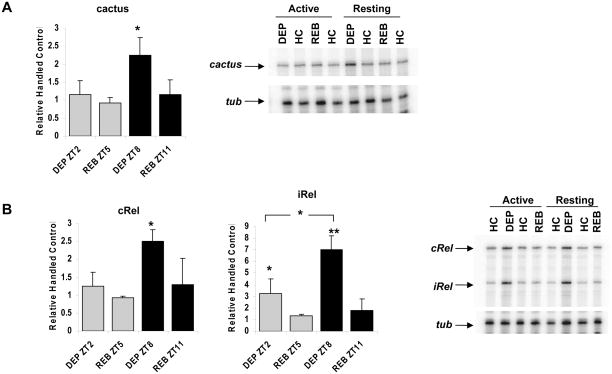
Figure 2.
Up-regulation of immune response genes during sleep deprivation. RNase protection assays were performed to measure relative mRNA abundance of indicated genes relative to a control, tubulin (tub) under different experimental conditions. Flies were sleep deprived from ZT 22-2 (during their activity period, gray) or from ZT 4–8 (during their resting period, black) and collected at indicated time points. A. Levels of cactus are plotted relative to handled control (HC; left panel). Levels in DEP ZT 8 are higher than in all other conditions and time points (* = P< 0.05); representative RPA is shown in the right panel. B. Levels of cRel (left panel; * = P<0.01) and iRel (middle panel; * = P <0.05 and ** = P<0.001) are plotted relative to HC. mRNA levels of iRel in DEP ZT2 and DEP ZT8 are higher as compared to all other HC and REB groups as indicated by asterisks. The difference in iRel mRNA levels between DEP ZT2 and DEP ZT8 is also significant as shown by the bracket (* = P<0.05). A representative RPA is shown in the right panel. All experiments were performed in y w flies; each chart represents 3 independent experiments.

