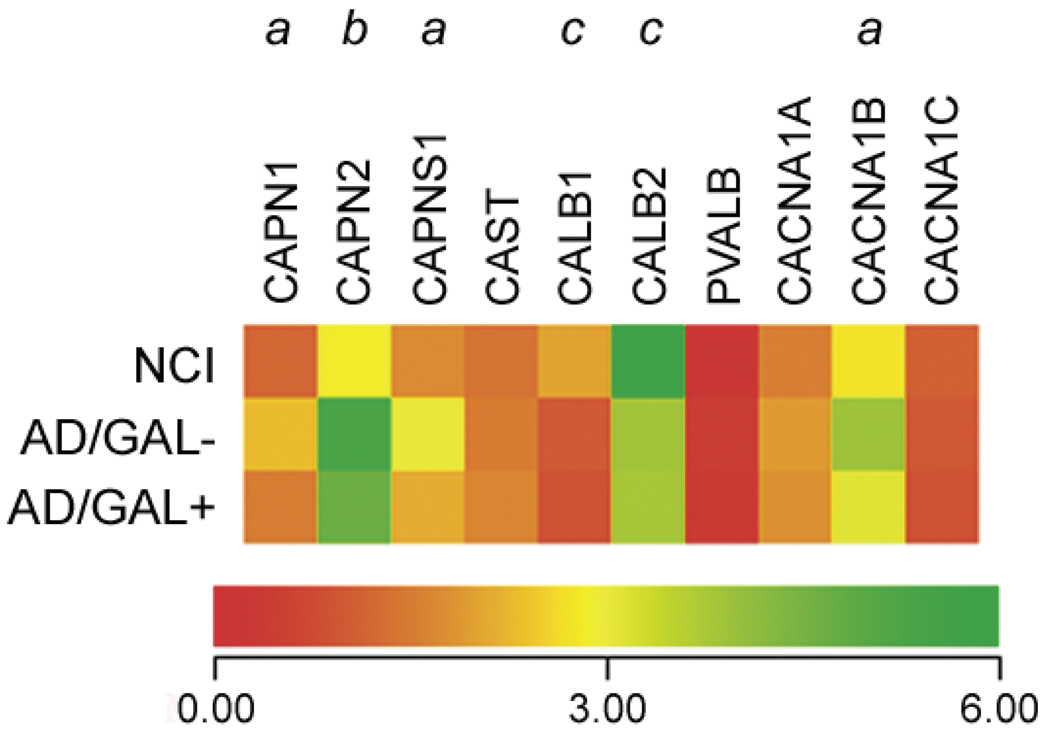
Fig. 3.
GAL hyperinnervated NB neurons display preserved calpain transcripts levels in AD. Heatmap illustrating relative mRNA expression levels (red to green = increasing levels) of the µ-calpain (Unigene/NCBI notation CAPN1) and µ-calpain (CAPN2) catalytic subunits, the small capain regulatory subunit (CAPNS1), calpistatin (CAST), calbindin (CALB1), calretinin (CALB2), parvalbumin (PVALB), and the P/Q-type (CACNA1A), N-type (CACNA1B), and L-type (CACNA1A) voltage-gated Ca2+ channel subunits. a = AD/GAL− > NCI, AD/GAL+, p < 0.01; b = AD/GAL−, AD, GAL+ > NCI, p < 0.01; c = NCI > AD/GAL−, AD/GAL+, p < 0.01.

