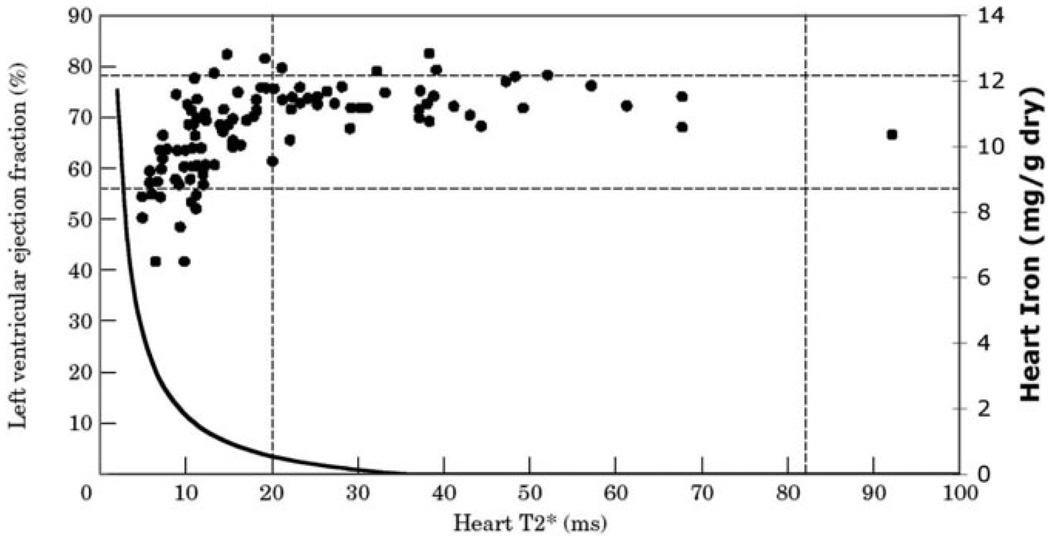
Figure 1.
Plot of ejection fraction (left axis) versus heart T2* in milliseconds. T2* >20 ms represents patients with no detectable cardiac iron. Horizontal dotted lines represent predicted population norms for ejection fraction in nonthalassemia subjects. Solid line represents calibration curve for cardiac iron (right axis) as a function of cardiac T2*. Predicted cardiac iron for patients having a T2* of 2 to 10 ms is 1.8 to 10 mg/g dry weight, consistent with published autopsy studies. Figure reprinted from Circulation.15

