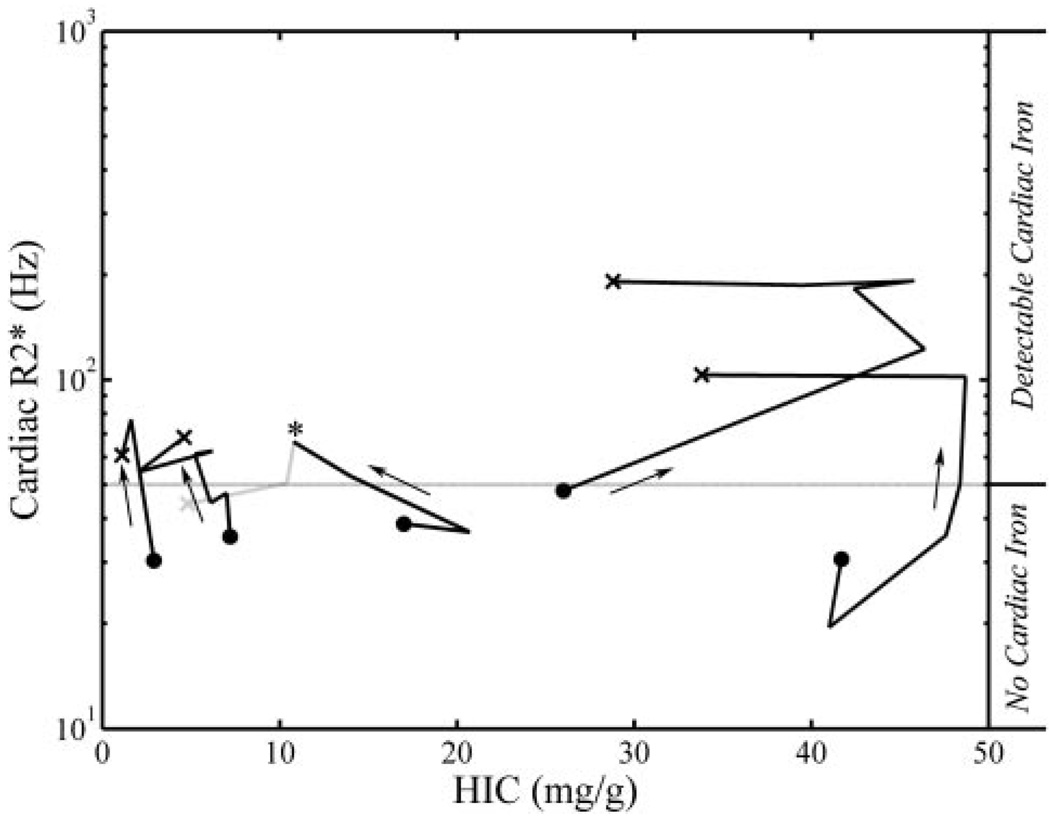
Figure 2.
Time course of cardiac R2* (as a surrogate for heart iron) versus hepatic iron concentration (HIC); each line represents 3 to 6 sequential measurements. Cardiac R2* is plotted on a log scale. Solid points represent first examinations, crosses represent final measurements, and arrows reinforce the temporal direction; each examination was separated by 6–18 months. As a time course crosses the gray horizontal line (lower limit of detection for cardiac iron) it represents de novo accumulation of cardiac iron. Figure adapted from Wood JC, Enriquez C, Ghugre N, Tyzka JM, Carson S, Nelson MD, Coates TD. MRI R2 and R2* mapping accurately estimates hepatic iron concentration in transfusion-dependent thalassemia and sickle cell disease patients. Blood. 2005;106:1460–1465.

