
Fig 1.
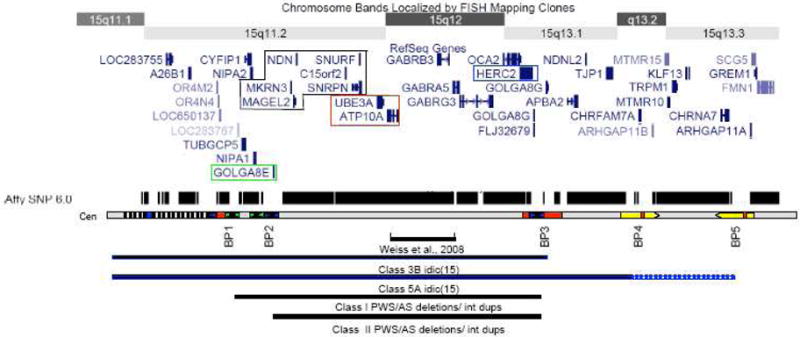
Schematic of chromosome 15q11.1-13.3 showing the position of known genes based on the UCSC genome browser. Maternally expressed transcripts highlighted in red, and paternally expressed transcripts in black. The HERC2 gene is highlighted in blue and the GOLGA8E gene is highlighted in green. (Below) The relative positions of the 5 BP clusters are shown below with sequence homology indicated by color, blue indicating regions of homology to HERC2 and green indicating regions of homology to GOLGA8E. The black and white hatching indicates a heteromorphic region near the centromere that includes a number of pseudogenes and can expand in the normal population. At least one HERC2 based repeat lies in this region. The track above the breakpoint schematic shows the density of SNP coverage for this region on the Affymetrix 6.0 whole genome array with notable gaps at the positions of the common BPs, although not all probes for detecting copy number variations are shown in the UCSC browser. The region included in Class I and Class II deletions/duplications is indicated by the black bars at the bottom with the position of the small duplication identified by Weiss et al (2008) also noted. Similarly, the region encompassed by the two most common forms of idic(15) chromosomes is indicated with solid blue line indicating a region of tetrasomy and dashed line indicating trisomy.