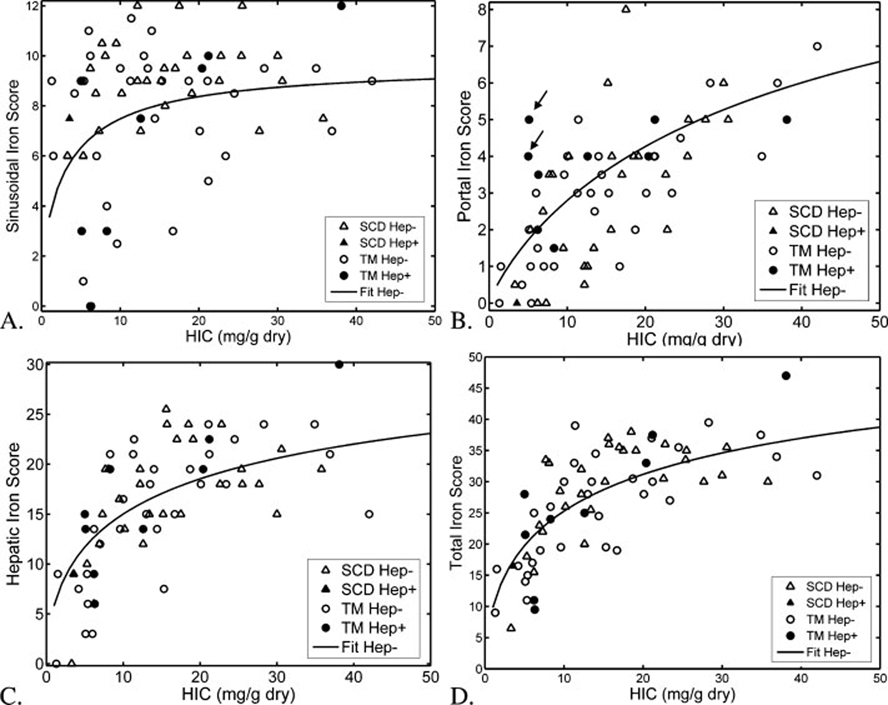
Figure 1.
Plots demonstrate sinusoidal (A), portal (B), hepatocyte (C), and total (D) iron scores as a function of hepatic iron concentration in patients with TM (circles) and SCD (triangles). Open symbols represent hepatitis-negative patients; filled symbols reflect hepatitis-positive patients. The curves shown represent logistic functions optimally fitted to the pooled hepatitis-negative data points; logistic function parameters had no significant disease dependence. The logistic function was a poor fit to the sinusoidal iron score-biopsy relationship, but had an r2-value greater than 0.36 for the other three scores.

