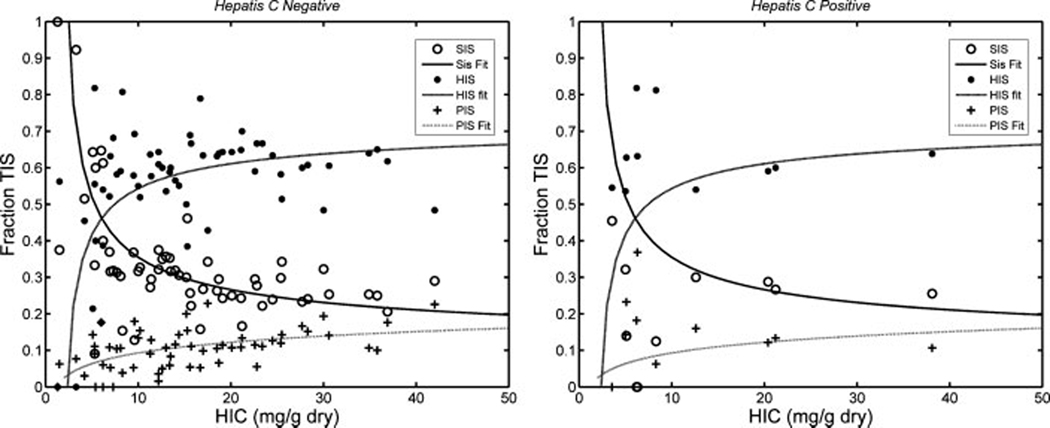
Figure 2.
Plot demonstrates hepatocyte, sinusoid, and portal iron scores as a percent of TIS. Sinusoidal and hepatocyte loading exhibit a reciprocal relationship with HIC, with iron deposition beginning in the sinusoids and propagates into the hepatocyte and portal areas as sinusoids are saturated (HIC between 5 and 10 mg/g). Left hand panel represents hepatitis-negative patients and their corresponding curve fit. Right hand panel depicts hepatitis-positive patients compared with the curve fit’s derived from the hepatitis-negative patients.

