FIG. 1.
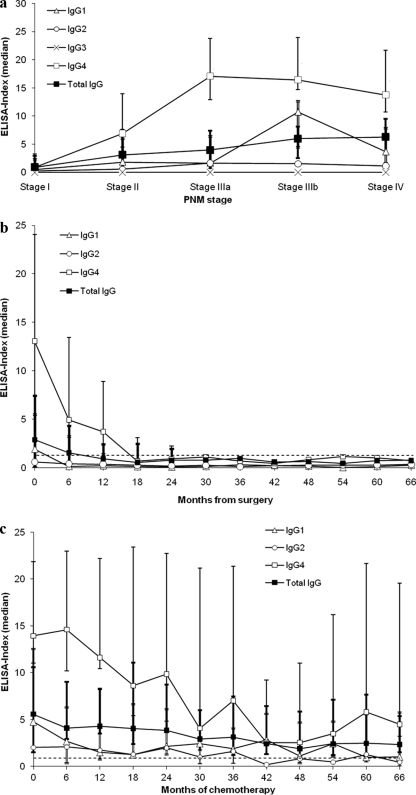
(a) Correlation of the PNM stage and the ELISA-index prior to treatment. Median index values of the respective antibodies against Em18 are displayed for each PNM stage. The highest median index in all stages was demonstrated for IgG4, whereas IgG3 was completely unreactive. The lowest positive median indices in all stages were demonstrated for IgE (data not shown) and IgG2. A constant increase in the median values of the total IgG index in parallel with the clinical stage is visible. IgG4 indices showed a close-to-linear increase for stages I to IIIa only. Error bars represent ranges for total IgG (bold lines), IgG4 (thin single lines), and IgG1 (thin double lines). Spearman's rank correlation coefficients (ρ) for total IgG, IgG4, and IgG1 with all PNM stages (stages I to IV) were 0.532 (Ρ, <0.001), 0.499 (Ρ, <0.002), and 0.358 (Ρ, <0.05), respectively. (b) Antibody profiles of patients after curative resection. Median index values from all assays (except those for IgG3 and IgE) for 13 patients at different clinical stages are presented. Rapid declines in the antibody indices of total IgG, IgG1, and IgG4 are clearly visible. Error bars represent ranges (until month 24) for total IgG, IgG4, and IgG1 as explained for panel a. Serological data were accumulated for intervals of 6 months. At each given interval, data from 2 to 13 patients were available. The cutoff level is 1, represented by the dashed line. The time of resection is month zero. (c) Antibody profiles of patients with stable disease and unresectable lesions. Median index values from all assays (except those for IgG3 and IgE) for 16 patients at different clinical stages are presented. A slow decline in the antibody indices is visible. Error bars represent ranges for total IgG, IgG4, and IgG1 as explained for panel a. Serological data were accumulated for intervals of 6 months. At each given interval, data from 5 to 16 patients were available. The cutoff level is 1, represented by the dashed line. The start of chemotherapy is at month zero.

