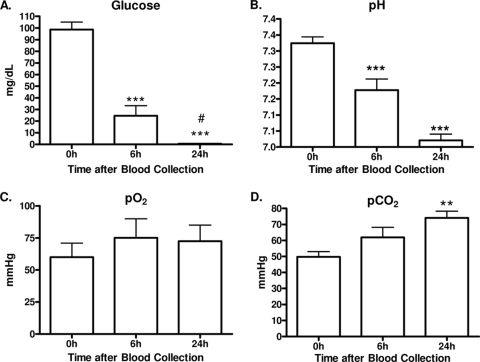
FIG. 1.
Glucose and blood gas analysis. Human whole blood was analyzed for glucose levels (mg/dl) (A), pH (B), pO2 (C), and pCO2 (D). Results are expressed as mean ± SEM (n = 8 donors) compared by ANOVA and the Newman-Keuls post test. **, P < 0.01; ***, P < 0.001 (compared to 0 h); #, P < 0.05 (compared to 6 h).

