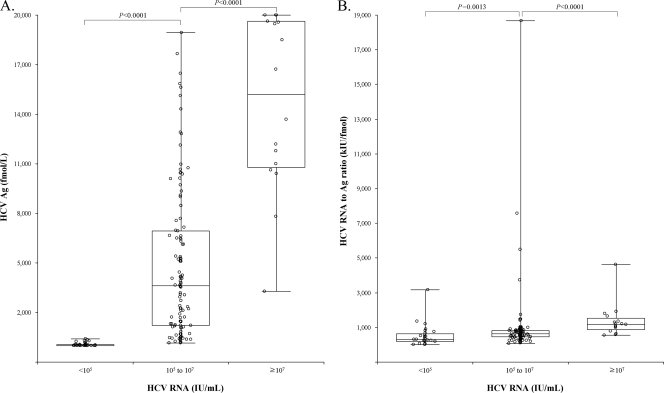
FIG. 2.
HCV Ag levels and RNA-to-Ag ratio according grouped by HCV RNA levels. (A) Median HCV Ag levels were 11, 3,630, and 15,190 fmol/liter for the groups of RNA levels <105, 105 to 107, and ≥107 IU/ml (groups A, B, and C), respectively. HCV Ag levels showed significant differences between those groups (P < 0.0001). (B) The RNA-to-Ag ratios of those groups were also significantly different from each other (median of 301, 646, and 1,181 kIU/fmol for groups A, B, and C, respectively) (P < 0.0013 for group A versus B, and P < 0.0001 for group B versus C). The upper and lower ends of boxes and box inner lines correspond to the upper and lower quartiles and median values, respectively. Whiskers denote minimum and maximum values, and circles indicate individual values.

