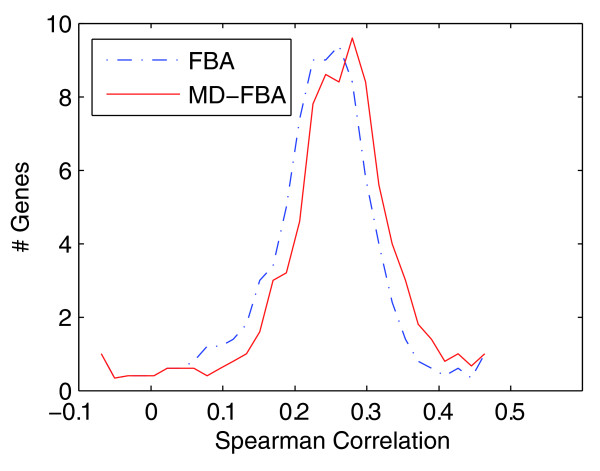
Figure 2.
Histograms of Spearman correlation values between measured and predicted growth rates. The histograms show the accuracy of FBA (blue, dash-dot line) and MD-FBA growth rate predictions (red, solid line) for 81 gene deletion strains across 96 growth media. The median Spearman correlation for MD-FBA is significantly higher than that of FBA (Wilcoxon test P-value = 0.0145).

