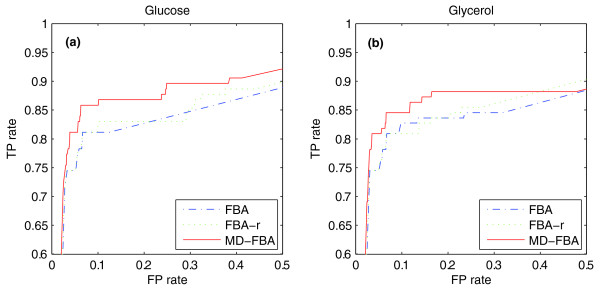
Figure 4.
ROC curves of gene essentiality predictions. ROC curves of gene essentiality predictions under (a) glucose and (b) glycerol minimal media. Predictions were made by FBA, FBA-reduced biomass (FBA-r; utilizing the reduced biomass definition) and MD-FBA, where MD-FBA is shown to outperform both FBA and FBA-r under both growth media. FP, false positive; TP, true positive.

