Figure 2.
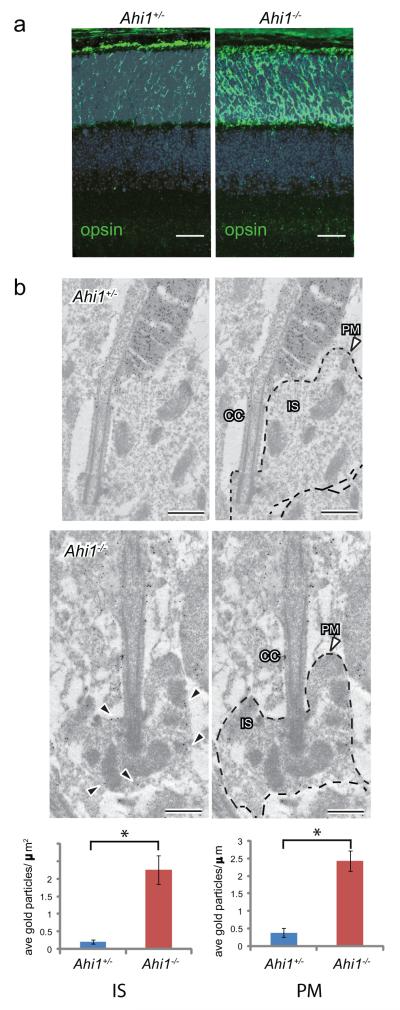
Opsin accumulation in Ahi1−/− photoreceptors (a) Opsin immunofluorescence (green) at P10 in Ahi1+/− and Ahi1−/− retina from cryosections. Nuclei are stained with Hoescht 33342. Scale=20μm (b) Opsin immunoEM and quantification of immunogold labeling from ultrathin sections of P10 Ahi1+/− and Ahi1−/− retina, n=20-23 photoreceptor connecting cilia/genotype. Data are expressed as number of gold particles per μm2 area within the inner segment (IS, defined as within inner segment and at least 30nm away from PM, P=8.0E-06), and as number of particles per μm length of inner segment membranes (PM, dashed lines, P=2.2E-07). Black arrowheads indicate examples of abnormally localized opsin, CC=connecting cilium, scale=0.5μm, error bars represent s.e.m.

