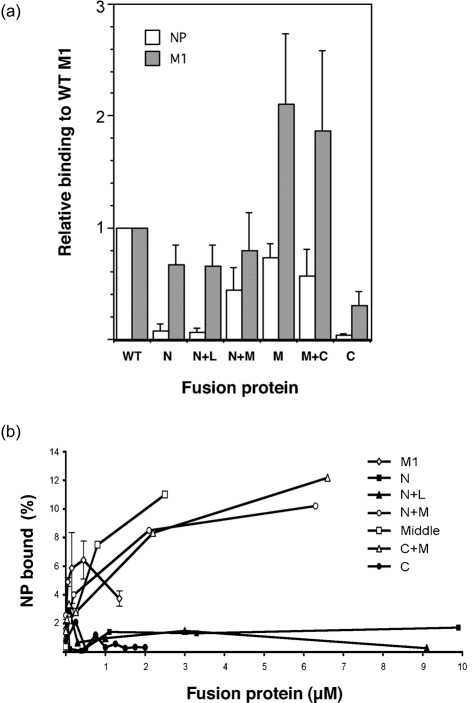
Fig. 2.
Quantitative analysis of NP- and M1-binding activity of the GST–M1 fusion proteins. (a) The amount of bound radiolabelled NP or M1 from three independent assays with the indicated GST-fusion proteins was quantified by densitometry. Values were corrected by the subtraction of any background seen with GST only, normalized with respect to the amount bound by WT M1, and plotted as the mean±sd. (b) The amount of radiolabelled NP bound by increasing concentrations of the indicated GST-fusion proteins was quantified similarly and expressed as the percentage of input material bound. Values are from a single representative experiment, except for full-length GST–M1, where the mean±range of three experiments is plotted.

