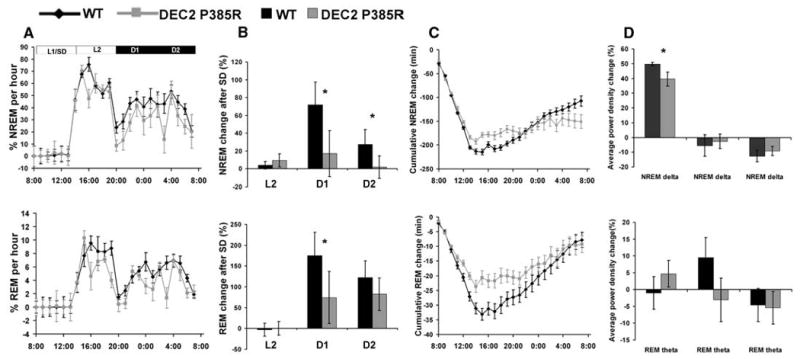
Fig. 3.

Altered sleep regulation in DEC2-P385R mice. Data for NREM sleep are shown in top panels and for REM sleep are shown in bottom panels. (A) Time course of NREM and REM sleep as percentage of time spent every hour during and after sleep deprivation for one day. (B) Percentage changes of time after sleep deprivation in comparison with the baseline condition for NREM and REM in L2, D1, and D2 for DEC2-P385R and WT mice. (C) Cumulative NREM and REM sleep loss and gain compared with baseline conditions for the sleep deprivation experiment. (D) Analysis of spectral sleep power changes compared with baseline conditions for L2, D1, and D2. Significant differences are marked with asterisks. P < 0.05, by one-tailed and two-tailed Student's t test. Error bars represent SEM.
