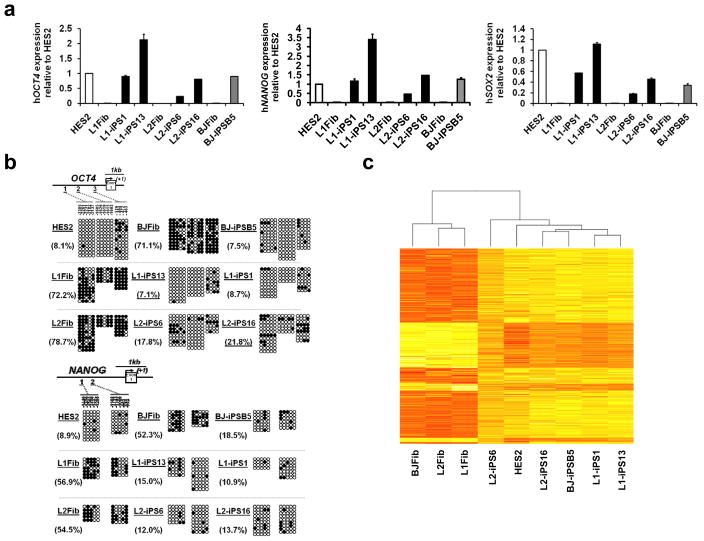
Figure 1. Gene expression profile in LS-iPSC is similar to HESC.
a, Quantitative real-time PCR assay for the expression of endogenous hOCT4, hNANOG and hSOX2 in iPSC and parental fibroblasts (Fib). PCR reactions were normalized against β-ACTIN and plotted relative to expression levels in HES2. Error bars indicate ± s.d. of triplicates. b, Bisulfite sequencing analyses of the OCT4 and NANOG promoters. The cell line and the percentage of methylation is indicated to the left of each cluster. c, Heat map showing hierarchical clustering of 3657 genes with at least two-fold expression change between the average of the three fibroblast cell lines versus all the iPSC lines/HES samples. Expression levels are represented by color; red indicates lower and yellow higher expression.

