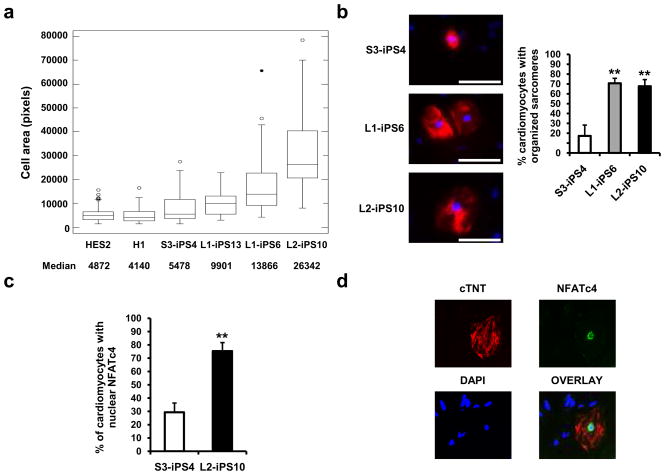
Figure 3. Cardiomyocytes derived from LS-iPSC show hypertrophic features.
a, HES2, H1, wt S3-iPS4 and three LS-iPS clones, were differentiated into cardiac lineage. Cell areas of 50 random cTNT-positive cardiomyocytes of each cell line were measured using ImageJ. Boxes show the span from the median (50th percentile) to the first and third quartiles. The lines represent the largest/smallest sizes that are no more than 1.5 times the median to quartile distance. Additional points drawn represent extreme values. b, Sarcomeric organization was assessed in 50 cTNT positive (red) cardiomyocytes. Data are presented as mean ± s.d. n = 3; **P < 0.01 (Student’s t-test). c, S3-iPS4 and L2-iPS10 cells-derived cardiomyocytes were restained with NFATc4 antibody, and the nuclear versus cytosolic expression was analyzed. n = 3; **P < 0.01 (Student’s t-test). d, Nuclear localization of NFATc protein in a cTNT-positive cell from L2-iPS10 is shown.

