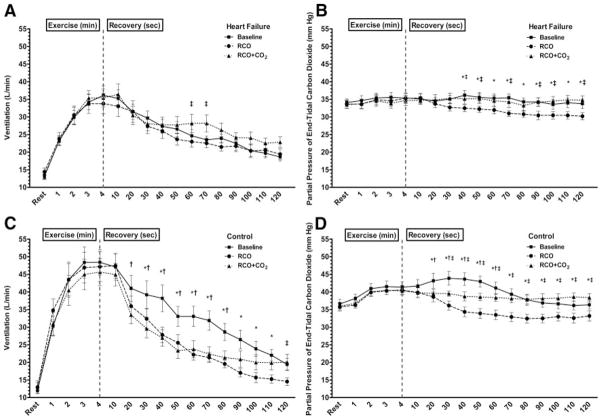
Figure 1.
VE and PETCO2 for the HF (A and B) and CTL (C and D) groups during 3 exercise conditions. All significance symbols are described after Bonferroni correction. Data are reported as mean±SEM. *Significant difference between the baseline exercise session and the RCO session (P<0.05); †significant difference between the baseline exercise session and the RCO+CO2 session (P<0.05); and ‡significant difference between the RCO and RCO+CO2 session (P<0.05).

