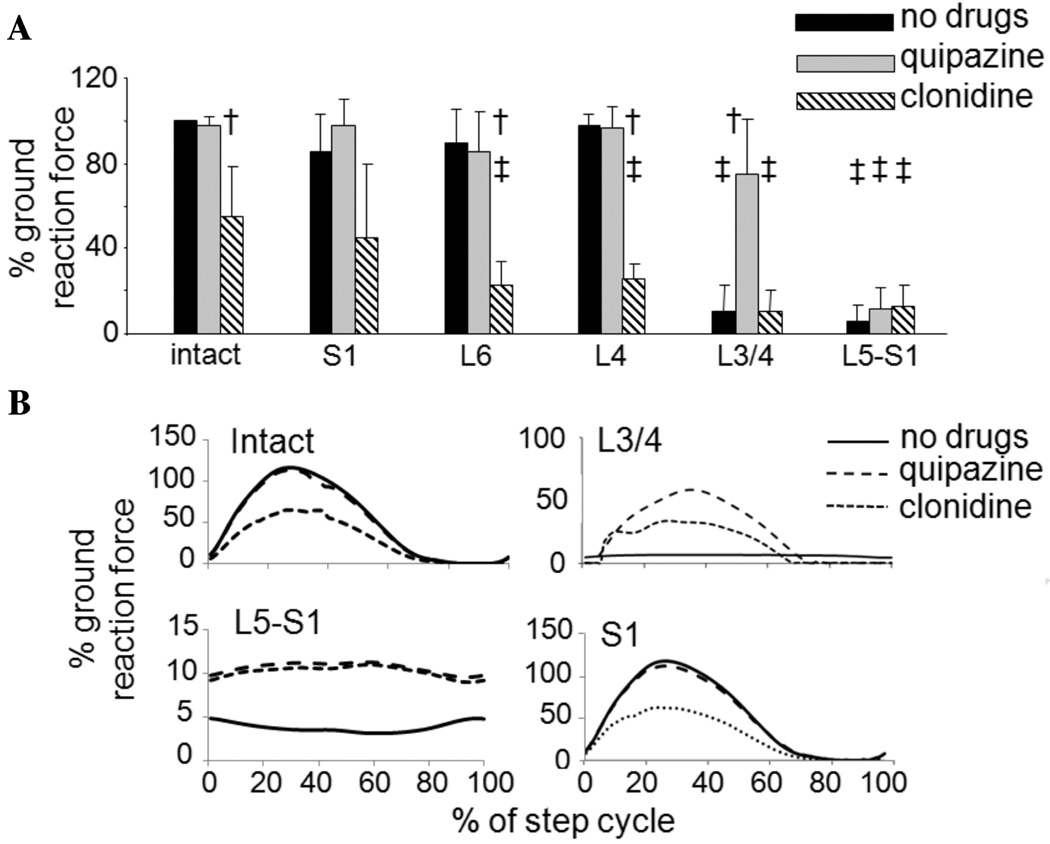
Figure 5.
GRF generated during hindlimb stepping following the various rhizotomies. The forces are normalized to the load carried by the limb during full weight-bearing standing prior to the deafferentation. (A) Mean GRF and standard deviation bars are shown for all animals in the study. No decreases in force were seen with the S1, L6, and L4 deafferentations relative to predeafferentation levels (black bars), while large decreases were seen following the L3/4 and L5-S1 deafferentations. Quipazine generally increased the peak GRF, especially following the L3/4 deafferentation (gray bars), while clonidine generally decreased it (hashed bars). Cross symbols (†) indicate the significant changes in GRF induced by the application of pharmacological agents within a condition (sensory intact or a particular deafferentation). Double cross symbols (‡) indicate the significant changes in GRF relative to predeafferentation levels. (B) GRF averaged over a step cycle for a spinal animal with intact dorsal roots, an animal with L3/4, L5-S1, or S1 rhizotomy. In each plot the no-drugs (solid), quipazine (dashed), and clonidine (dotted) traces are shown. Note that the y-axis range is different for the different rhizotomy conditions.

