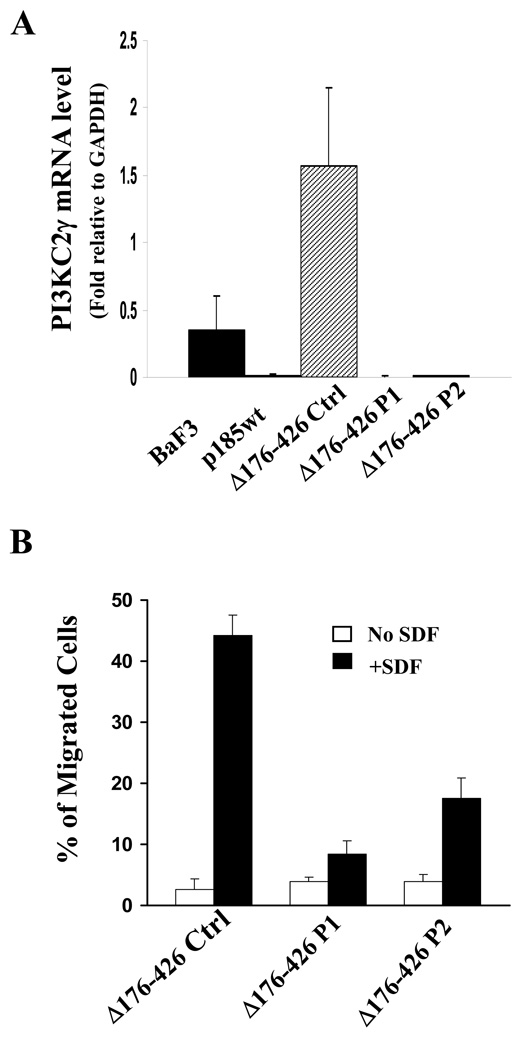
Figure 4. Knockdown of the PI3KC2γ expression in p185Δ176–426 cells inhibited SDF1α-stimulated chemotaxis.
A. Knockdown of PI3KC2γ expression in p185Δ176–426 cells. Total RNAs isolated from Ba/F3, p185wt, and p185Δ176–426 cells transduced with control retrovirus (p185Δ176–426 Ctrl) or retroviruses expressing two shRNAs that specifically target different region of PI3KC2γ mRNA (p185Δ176–426 P1 and p185Δ176–426 P2) were subjected to qRT-PCR analysis. The vertical axis shows the PI3KC2γ mRNA levels relative to that of GAPDH. The data represents the average +/− S.D. calculated from triplicates of a representative experiment. Two independent experiments were performed. B. Knockdown of PI3KC2γ expression impaired the SDF1α-stimulated chemotaxis of p185Δ176–426 cells. 1×10⁵ p185Δ176–426 cells transduced with indicated retroviruses were tested in trans-well migration assay for their abilities to migrate spontaneously (no SDF) or in response to SDF1α (+SDF, 100ng/ml). The vertical axis shows the percentage of migrated cells. The data represents the average +/− S.D. calculated from triplicate wells of a representative experiment. Two independent experiments were performed.

