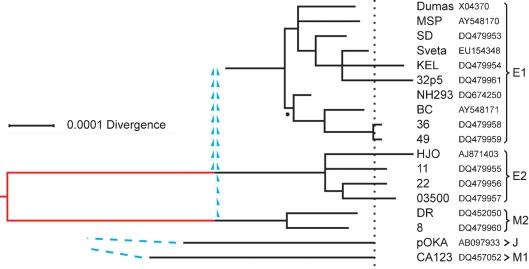
Fig. 4.
Phylogenetic relationships among VZV UL sequences. BMCMC was used to derive a phylogenetic tree for the six sequences in the E2 plus M2 groups, and a separate, partial tree for the ten E1 sequences. The branching structures shown for the E1 and E2 groups are majority-rule trees, in which all resolved nodes had estimated posterior probabilities of 1.00 except for the E1 node marked with a dot, which had a posterior probability of 0.69. The red section in the E2–M2 tree corresponds to the contribution of the cross-group SNPs, and the tree was rooted at the midpoint of this section. The dotted line represents the positions of average tip loci between the E2 and M2 groups. Branch lengths for the J and M1 groups correspond to their singleton SNP sets. For E1, J and M1 groups, mean loci for the tips of terminal branches are placed on the dotted line. The recombinational origins of the E1 group from the E2 and M2 lineages are indicated by blue arrowheads, and the unresolved deep connections of the J and M1 groups by blue dashed lines. The scale bar indicates substitutions per site in the UL alignment.

