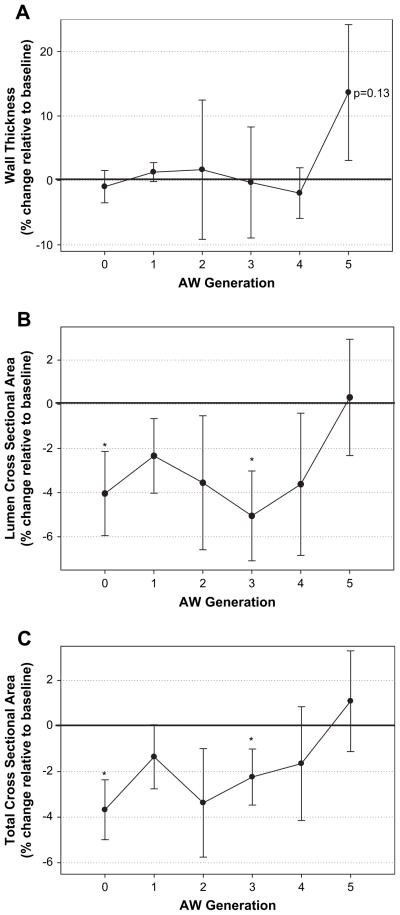
Fig. 5.
Percent changes in airway structure relative to baseline measurements according to airway generation. Average values of the percent change in airway wall thickness measurements (A), airway lumen cross sectional area measurements (B), and total airway cross-sectional area (C) relative to baseline values for all subjects according to airway generation (lumen + airway wall). Generations 0 to 4 comprised of 16 individuals, whereas generation 5 comprised 10 individuals. Significant changes in airway cross-sectional area were noted at generations 0 and 3. Airway wall thickness tended to increase at generation 5, although this change was not statistically significant.

