Fig. 1.
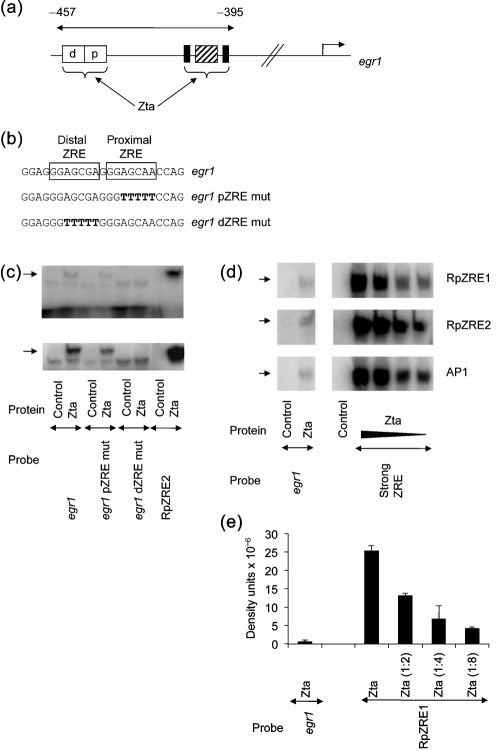
Interaction of Zta with egr1ZREs. (a) The organization of the egr1 promoter is shown schematically. The numbers represent distance from the transcription initiation site. The Ets response elements are shown by filled boxes, with the SRE hatched. The open boxes represent the tandem ZREs, proximal (p) and distal (d). (b) The nucleotide sequence of one strand of the oligonucleotide spanning the ZREs is shown. egr1 represents the wild-type sequence, egr1 dZRE mut, the mutation in the distal ZRE and egr1 pZRE mut, the mutation in the proximal ZRE. Double-strand versions of these sequences were used as probes for EMSA. (c) EMSA analysis of the interaction between Zta and egr1, egr1 pZRE mut, egr1 dZREmut and RpZRE2 was undertaken as described previously (Schelcher et al., 2005, 2007). Probes were labelled to approximately equivalent specific activities and the relative amounts used in the reactions are: egr1 (1.0), egr1 pZRE mut (0.5), egr1 dZRE mut (0.7) and RpZRE2 (0.3). In these experiments the probe is in excess, as shown by the dose response in (d) and (e). Zta protein was generated in a wheatgerm translation system, and its interaction with a labelled probe was compared with an unprogrammed lysate as control. For each panel, complexes were separated on the same gel by electrophoresis and visualized by phosphoimaging. The exposure of the bottom panel was ten times longer than that shown in the top panel to visualize the weak Zta–egr1 protein–DNA complexes. The experiment was repeated with similar results. (d) EMSA analysis of the interaction between Zta and egr1, compared with known strong ZREs, RpZRE1 (GATCTCTTTTATGAGCCATTGGCA), RpZRE2 (GATCAAGCTTATGAGCGATTTTTAT) (Bhende et al., 2004) and AP1 (GATCCATGACTCAGAGGAAAACATACG) (Hicks et al., 2003; Kouzarides et al., 1991), were undertaken as in (c). The relative amounts of probes used in the reactions are equivalent. The experiment was repeated with similar results. (e) Quantification of the complexes for RpZRE1 and egr1. These were detected by phosphoimaging in two experiments. Error bars indicate sd.

