Fig. 2.
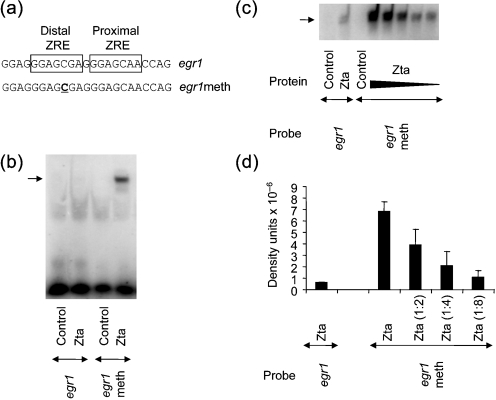
Interaction of Zta with methylated egr1ZRE. (a) The nucleotide sequence of one strand of the oligonucleotide spanning the ZREs is shown, together with the methylated version (underlined). Double-strand versions of these sequences were used as probes in EMSA. (b) EMSA analysis of the indicated proteins with the egr1 probes was carried out as described in Fig. 1. Probes were labelled to approximately equivalent specific activities and the relative amounts used in each comparison are egr1 (1.0) and egr1meth (0.72). The experiment was repeated with similar results. (c) EMSA analysis of the interaction between Zta and egr1, compared with the methylated egr1 was undertaken using serial dilutions of Zta protein. The experiment was repeated with similar results. (d) Quantification of the complexes for egr1meth and egr1 (density units×10−6) after adjustment for the relative amounts of probes used for each EMSA. These were detected by phosphoimaging in two experiments. Error bars indicate sd.

