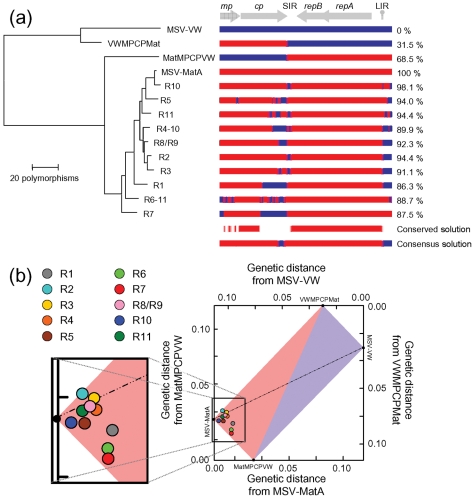
Fig. 4.
Convergence of recombinants on the target recombinant solution. (a) Dendrogram graphically depicting the convergence of recombinants (R1–R11) on the target solution (MSV-MatA). Red and blue, respectively, indicate MSV-MatA- and MSV-VW-derived sequences. The percentage of MSV-MatA-derived polymorphisms occurring in each recombinant is shown to the right. Genome regions (above) are labelled as in Fig. 1. (b) A Hamming distance graph illustrating that recombinant genomes resemble MSV-MatA. Each point represents one recombinant sequence with the positions of parental chimaeras, MSV-MatA and MSV-VW indicated on the axes.

