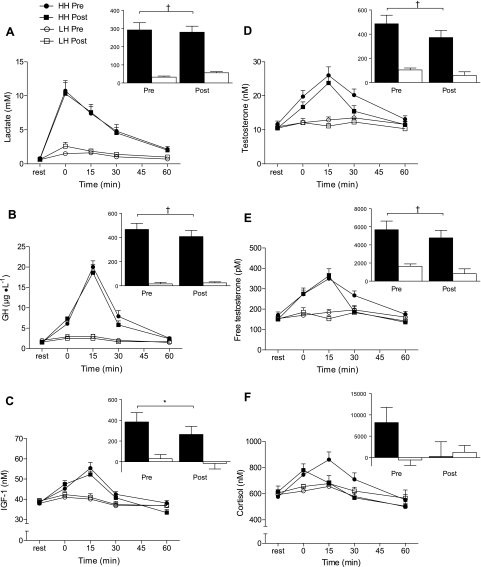
Fig. 1.
Whole blood lactate (A) and serum growth hormone (GH; B), IGF-1 (C), total testosterone (D), free testosterone (E) and cortisol (F) concentrations at rest and after low hormone (LH) and high hormone (HH) exercise protocols. Insets: net area under the curve (AUC; rest = 0); closed bars, HH; open bars, LH. Significantly greater than LH for corresponding time points and for AUC, *P < 0.01, †P < 0.001. Values are means ± SE.

