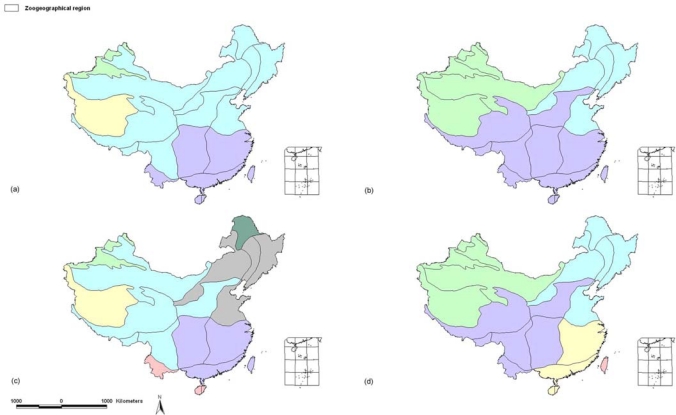
Figure 3.
Sketch of subregional topologies based on Figure 2. (a) sketch based on the 1976 dataset as in Figure 2a at the four terminal branches scale; (b) based on the 2007 dataset as in Figure 2b at the three terminal branches scale; (c) based on Figure 2a at the seven group scale; (d) based on Figure 2b at the five group scale.

