
Figure 2.
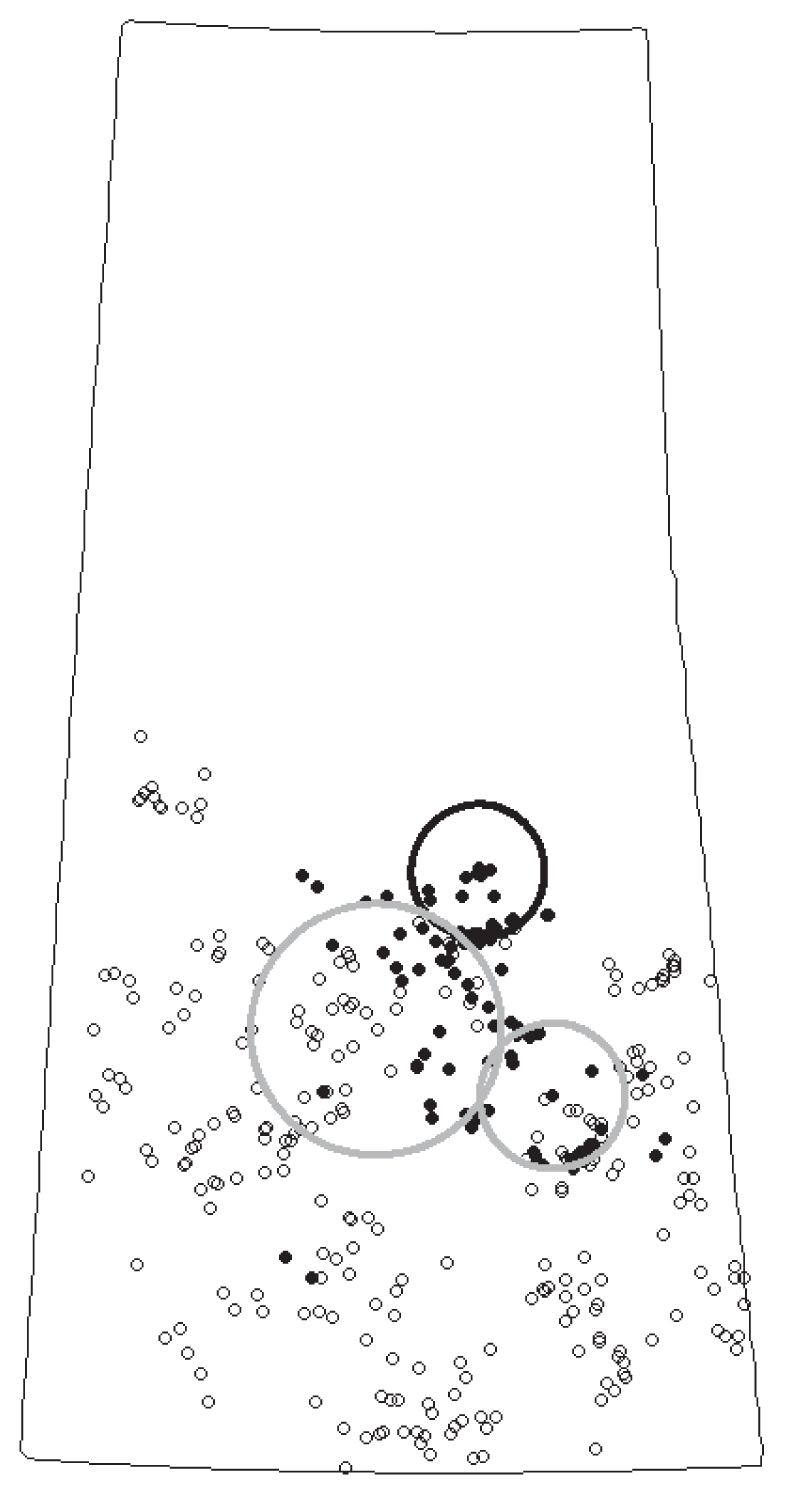
Results of the spatiotemporal SaTScan analysis for individual bovine farms. Case locations are depicted as small closed black circles and control locations depicted as small open black circles. Larger dark-colored circle outline depicts primary cluster and larger light-colored circle outline depicts secondary cluster(s).