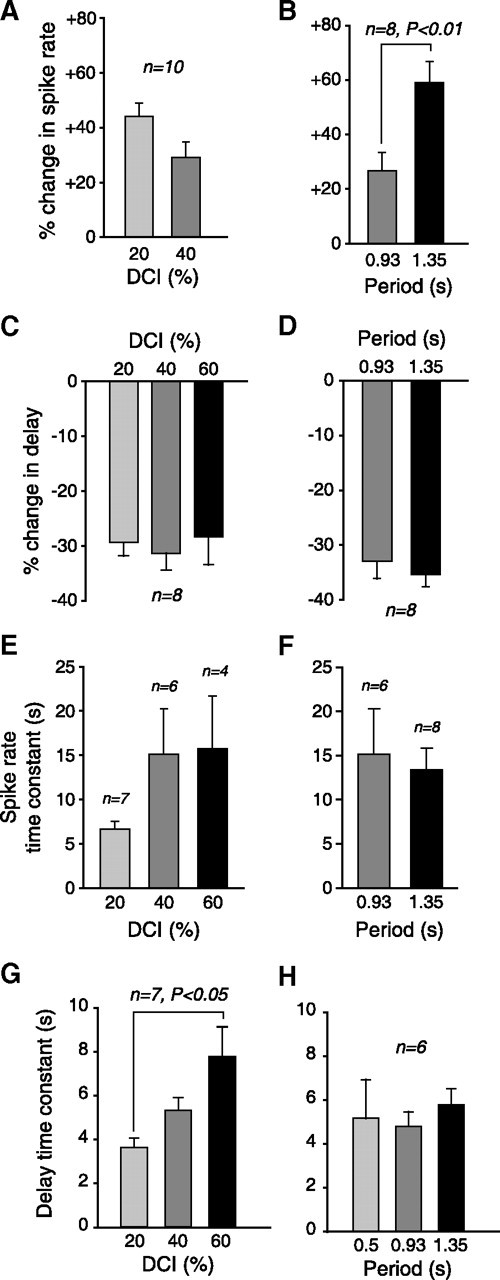
Figure 2.

Summary data on slow postinhibitory rebound, showing effect of varying period and DCI. A, Mean change in spike rate, for different DCIs. Sixty percent DCI not shown because cells rarely spiked during early cycles in this condition. B, Mean change in spike rate, for different periods. Period of 0.5 s not shown here or in D and F because cells rarely spiked during early cycles in this condition. C, Mean change in delay to first spike, for different DCIs. D, Mean change in delay to first spike, for different periods. E, Mean time constant of change in spike rate, for different DCIs. F, Mean time constant of change in spike rate, for different periods. G, Mean time constant of the change in delay over the course of stimulation, for several different DCIs. H, Mean time constant of the change in delay over the course of stimulation, for several different periods. Panels A, C, E, and G all show data for a period of 0.93 s. B, D, F, and H all show data for a DCI of 40%. Error bars in all panels give SEM.
