
Figure 2.
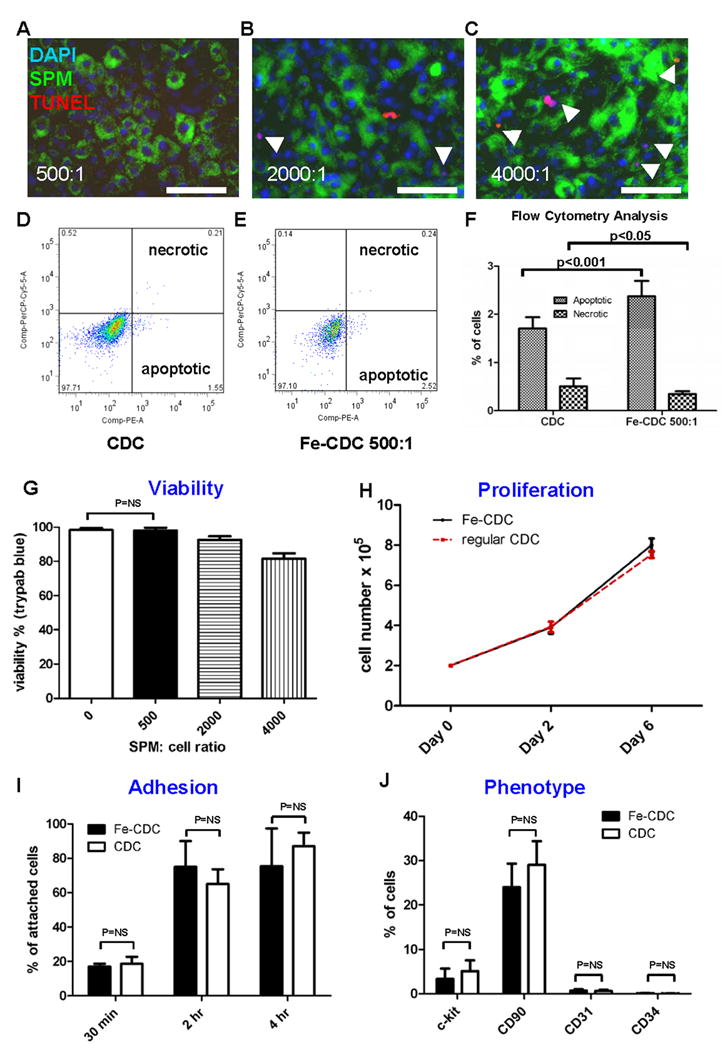
Effects of SPM labeling on cell death and function. A-C, microscopy images of TUNEL staining (Red: apoptotic cells; green: SPMs; blue: nuclei). CDCs were co-incubated with SPMs for 24 hours at varying SPM:cell ratios: 500:1 (A); 2000:1 (B); 4000:1 (C). Apoptotic cells (red color) are highlighted with white arrowheads. Bars = 50 μm. D and E, Typical plots of Annexin/7-AAD flow cytometry from non-labeled CDCs (D) and SPM-labeled CDCs (E). F, quantification of apoptotic and necrotic cells by flow cytometry (n=9 for CDC; n=8 for Fe-CDC). CDCs were labeled with SPMs for 24 hours and then examined for viability and function. G, viability of SPM-labeled CDCs assessed by Trypan Blue exclusion. Viability decrease was only observed in the 2000:1 and 4000:1 dosage groups, but not in the 500:1 group. H, proliferation of Fe-CDCs (labeled at 500:1 SPMs) compared with that of control CDCs (n=4). Cell counts at Day 0, 2 and 6 were equivalent in the two groups. I, adhesion potency of Fe-CDCs (labeled with 500:1 SPMs) compared with that of control CDCs (n=3). Attached cell numbers at 30 min, 2 hours and 4 hours were not statistically different in the two groups. J, phenotypic markers c-kit, CD90, CD31 and CD34 from Fe-CDCs (n=8) were compared to those from control CDCs (n=9). No statistical differences were detected for any of those markers.