
Figure 5.
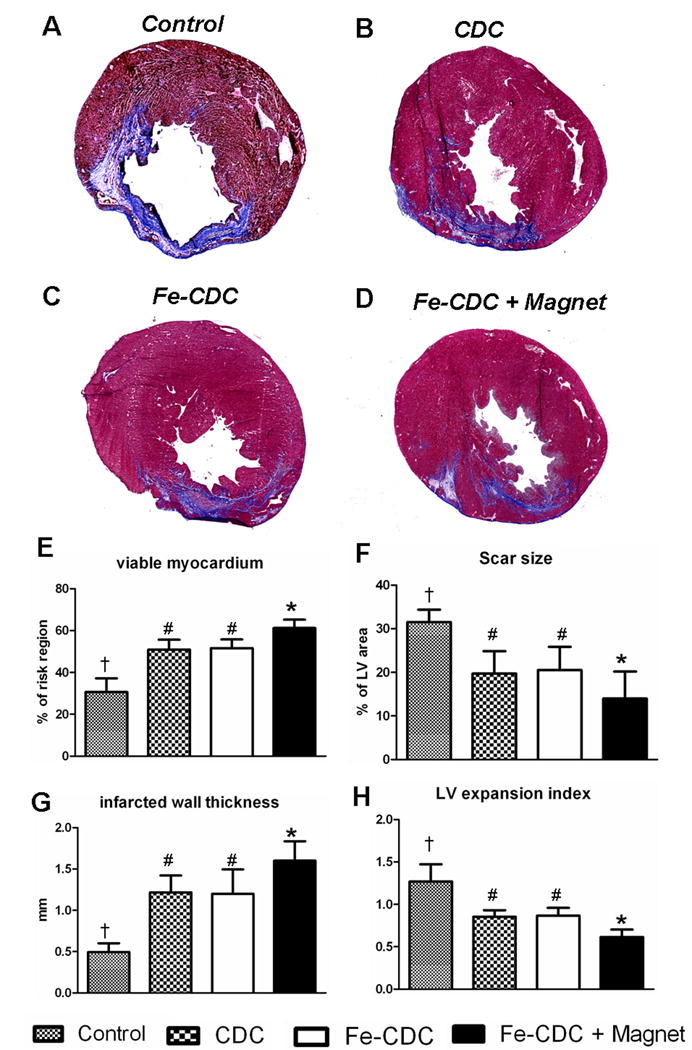
Morphometric heart analysis. A-D, Representative Masson's trichrome-stained myocardial sections from a subgroup of animals at 3 weeks after treatment (n=6 for Fe-CDC+Magnet and Fe-CDC; n=5 for CDC and Control). Scar tissue and viable myocardium are identified in blue and red color, respectively. E-H, quantitative analysis and LV morphometric parameters (for definition and calculation methods, please see Supplemental Materials-Detailed Methods). † indicates P<0.05 when compared to any other groups. # indicates P=NS. * indicates P<0.05 when compared to any other groups.