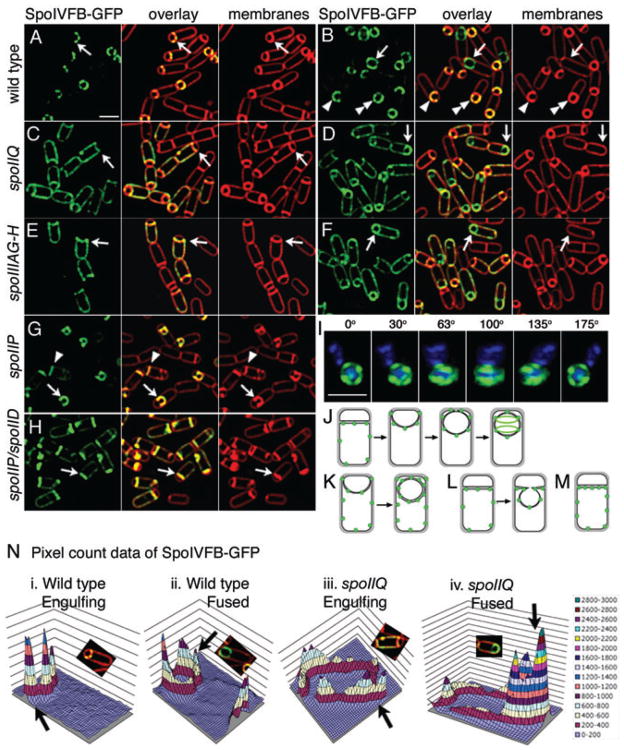
Fig. 5.
Localization of mother cell-expressed SpoIVFB-GFP (green). Live cells expressing SpoIVFB-GFP (green) at t2 (A, C, E) or t3 (B, D, F, G, H). FM 4–64 stained membranes are red.
A. Wild type (KP969) at t2. Arrow shows punctate localization early in engulfment. Bar = 2 μm.
B. Wild type (KP969) at t3. Sporangia before (arrowhead, double arrowhead) and after (arrow) membrane fusion.
C. spoIIQ (KP970) at t2. SpoIVFB-GFP is randomly distributed in mother cell membrane (arrow).
D. spoIIQ (KP970) at t3. SpoIVFB-GFP enriched at the forespore after fusion (arrow).
E. spoIIIAG-H (KP971) at t2. SpoIVFB-GFP randomly distributed (arrow).
F. spoIIIAG-H (KP971) at t3. SpoIVFB-GFP enriched at the forespore after fusion (arrow).
G. spoIIP (KP972) is engulfment defective. SpoIVFB localizes to flat septa (arrowhead) and bulges (arrow).
H. spoIIP spoIID double mutant (KP973).
I. Three dimensional reconstruction of SpoIVFB-GFP from 12 focal planes (z = 0.15 μm); rotated around the Y-axis. DAPI-stained DNA (blue). Bar = 2 μm.
J. SpoIVFB-GFP (green) localization during engulfment.
K. SpoIVFB-GFP (green) in the absence of either SpoIIQ or SpoIIIA.
L. SpoIVFB-GFP (green) in the absence of either SpoIIP, M or D or (M) both SpoIIP and SpoIID.
N. Quantification of SpoIVFB-GFP fluorescence intensity in wild type or spoIIQ. Deconvolved pixel count data from cells indicated by arrows in panels A (i), B (ii), C (iii) and D (iv) were imported into Microsoft Excel and three-dimensional graphs created. Scale on right.

