Fig. 1.
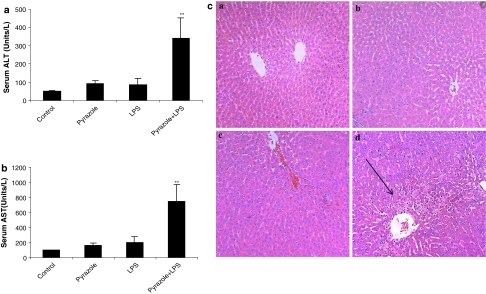
Effect of pyrazole or LPS or LPS plus pyrazole on serum ALT (a) or AST (b) or liver histopathology (c). In c, panels refer to a saline, b pyrazole-treated, c LPS-treated, d LPS plus pyrazole treated. Arrows show necrotic foci with inflammatory cell infiltration. **p < 0.01 compared to all other groups

